How similar are follow through bars to previous bars?
This study attempts to prove or disprove a hypothesis that a bar's appearance affects the bar that comes next. It
compares all pairs of consecutive bars in a very large dataset and assigns a similarity score to all the
follow through bars.
Visually the question asks if regardless of whether a bar is a trend bar or a doji, to what extent will the
follow through bar look similar (not necessarily exact but close)?
Methodology
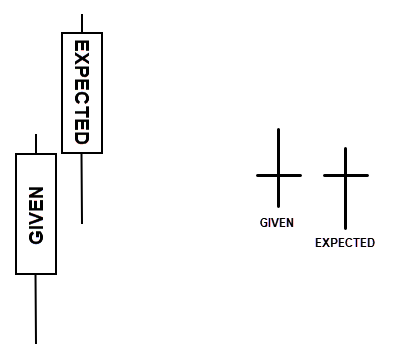
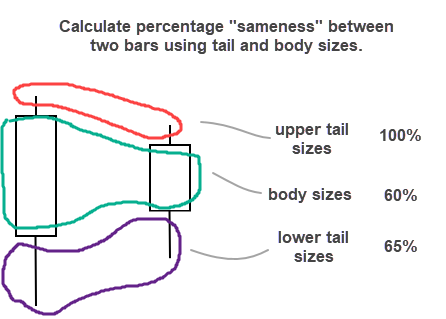
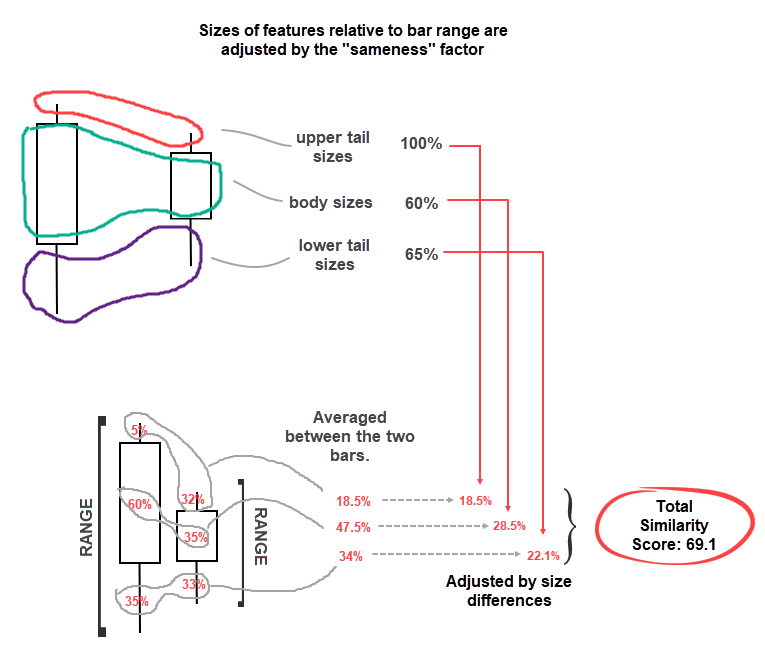
The similarity function uses the three main features of a bar: upper tail, lower tail and body. It then
calculates percentage difference between two given bars for each feature separately. For example, if the upper
tails on each
of the bars are exactly the same size it scores the tails at 100%. If one bar has a tail and the other one
doesn't it scores that feature as 0%. Similar process is repeated for bodies and lower tails. If the follow
through bar is of an opposite color to the previous bar
then
the whole process defaults to 0% and comparison moves on to the next pair.
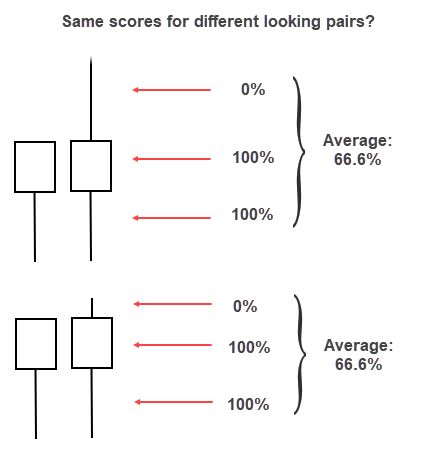
It's tempting to just average the scores now and be done with it, but there's a catch: since the similarity
function defaults to 0% as soon as one of the bars doesn't have a tail and the other one does, it creates a
situation where two pairs of different looking bars end up with the same score, which doesn't seem correct.
A workaround is to first evaluate the sizes of each feature relative to the range of a bar. That way, if the
tails are small compared to the rest of the bar they won't weigh as much on the final result.
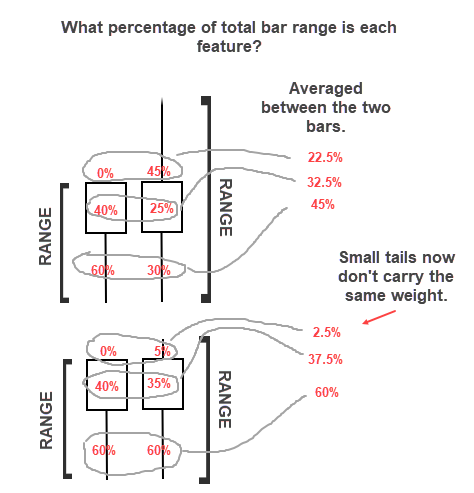
And now for the final magic trick, we use the size comparisons calculated at the very beginning to offset these
weights.
That was easy. We now have our similarity score function working and can run it against the historic dataset.
Results
Now comes the fun part. This process was run on over 337K bars so any context that may have influenced follow
through bar behavior would've been canceled out. We'll use histograms to analyse the results. If the hypothesis
is correct then the majority of follow through bars will cluster around the upper range of the similarity
function.
Result 1
Oh no! What's going on? There is a huge spike on the left completely offsetting our beautiful similarity function
results. Well, remember that if a follow through bar is of an opposite color the function defaults to scoring it
as simply 0. This result tells us that majority of FT bars are actually more likely to be of opposite color.
There were about 200K FT bars of opposite color. Since this is a historgram, we sum up the rest of the
similarity scores that fall above 0 to give us a count of how many FT bars were of same color: 137K. This means
that there's only a 40% chance to even get an FT bar of same color (excluding any other context).

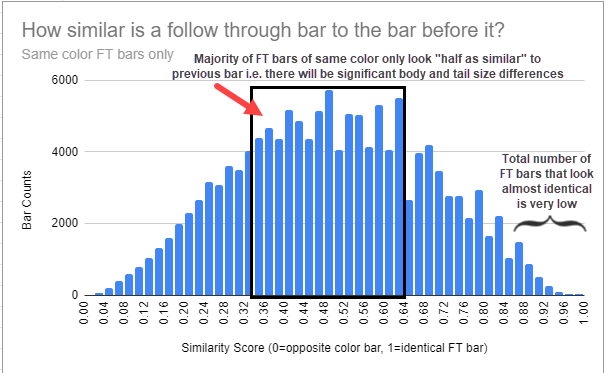
Result 2
Let's isolate just the results greater than 0 and focus on the FT bars that were of the same color. This
result is just as sad. The majority of FT bars of same color cluster around a "half similar" region. What we
were hoping to see, clustering around the upper range of similarity (>0.80 and above) constitutes a very small
percentage of the total.
Conclusion
This empirically disproves the hypothesis that any given bar, taken out of context, has any influence on the follow
through bar. As a word of caution to anyone wanting to use this result to build a countertrend strategy: this result
doesn't say
anything about reversals or strength of moves in the opposite direction. A strong bull bar followed by an opposite
color bar could be just a bearish doji and the trend may still resume higher. This study doesn't cover any of that,
only what or more precisely what
not to expect. As always, traders are encouraged to replicate and test these
results. All the code is freely available on
GitHub.
Risk Disclosures
CFTC Rule 4.41: Hypothetical or Simulated performance results have certain limitations,
unlike an actual performance record, simulated results do not represent actual trading. Also, since the
trades have not been executed, the results may have under-or-over compensated for the impact, if any, of
certain market factors, such as lack of liquidity. Simulated trading programs in general are also
subject to the fact that they are designed with the benefit of hindsight. No representation is being
made that any account will or is likely to achieve profit or losses similar to those shown.
Risk Disclosure: Futures and forex trading contains substantial risk and is not for
every investor. An investor could potentially lose all or more than the initial investment. Risk capital
is money that can be lost without jeopardizing financial security or lifestyle. Only risk capital should
be used for trading and only those with sufficient risk capital should consider trading. Past
performance is not necessarily indicative of future results.
Hypothetical Performance Disclosure: Hypothetical performance results have many inherent
limitations, some of which are described herein. No representation is being made that any account will
or is likely to achieve profits or losses similar to those shown; in fact, there are frequently sharp
differences between hypothetical performance results and the actual results subsequently achieved by any
particular trading program. One of the limitations of hypothetical performance results is that they are
generally prepared with the benefit of hindsight. In addition, hypothetical trading does not involve
financial risk, and no hypothetical trading record can completely account for the impact of financial
risk of actual trading. For example, the ability to withstand losses or to adhere to a particular
trading program in spite of trading losses are material points which can also adversely affect actual
trading results. There are numerous other factors related to the markets in general or to the
implementation of any specific trading program which cannot be fully accounted for in the preparation of
hypothetical performance results and all which can adversely affect trading results.
Trade Results Disclosure: Any trades presented may not have been traded in a live
account and should be considered hypothetical.
Trade/Chatroom Disclosure: Presentations are for educational purposes only and the
opinions expressed are those of the presenters only. All trades presented should be considered
hypothetical and should not be expected to be replicated in a live trading account.
Testimonial Disclosure: Testimonials appearing on this website may not be representative
of other clients or customers. Testimonials are not a guarantee of future performance or success.
See further disclaimers that may
help your understanding.